© Charles ChandlerIf main sequence stars cool with time, going from bright blue to dim red, we should be able to use well-known principles of thermodynamics to estimate the rate of the cooling, and thus come to understand the entire life cycle of such stars. The EM radiation emitted by a hot object depletes its kinetic energy, reducing the temperature. So if we know how many joules were in the energy store to start, and how fast the star is radiating energy, we can find how much cooler it will be after a given amount of time has passed.In the Energy Budget section, the primary energy source for the Sun was found to be the kinetic energy developed by the imploding dusty plasma. This came out to 6.67 × 1046 joules, where the Sun's mass of 1.99 × 1030 kg had been accelerated to 2.59 × 10⁸ m/s. Most of that energy got converted to electrostatic potential, but for the purpose of the light curve, we don't care what form the energy has taken — we just want to know how fast it is being depleted, and what effect this will have on the temperature of the star. So we can neglect the energy conversions, and just pretend that it's all still kinetic energy stored in linear velocity, which is mathematically equivalent to Brownian motion in a hot object. Then we can apply the known power output of the star to that motion, using it like a brake on the particle speed, where speed = √(power·time / ½·mass) as derived from Ek = ½·m·v2. Since temperature varies directly with particle speed, the braking action of the power take-off will be linear. So we just have to associate the initial particle speed with the initial temperature. Then, as we brake the particle speed, we can reduce the temperature by the same proportion. In other words, if the original speed was 100 m/s, and if the original temperature was 100 K, and if we lose 30 m/s to radiative heat loss, the temperature will now be 70 K.Yet the Sun has another type of energy that isn't depleted by radiative heat loss. In the CFDL model, 1/3 of the Sun's power comes from nuclear fusion, and this only gets depleted as the fusable elements get used up, which occurs over a much longer period of time. So when we brake the particle speed with power take-off, we'll only subtract 2/3 of the face value, leaving 1/3 of the stellar power unattenuated, since that was the component that came from nuclear fusion. Thus if the original particle speed was 100 m/s, and we expect to lose 30 m/s to radiative heat loss, and if 1/3 of the joules came from nuclear potential, radiative heat loss will only subtract 20 m/s from the speed, and the temperature will actually drop just to 80 K.What was the original temperature of the Sun when it first formed? For a place to start, we can consider Bellatrix, which is a star at the very beginning of the main sequence. It is thought to be only 20 million years old,1 and it currently has a color temperature of 22,000 K. In the present model, Bellatrix can't have much more than 1.4 solar masses, or the internal pressure would cause a Type 1a supernova. Since we have no way of directly measuring the mass of Bellatrix, we can just run the numbers at 1 solar mass, and see what happens. If the mass is (relatively) fixed, the only variable is the total amount of kinetic energy that was pumped into the system by the initial speed. But at 2.59 × 10⁸ m/s, we're already at 86.38% the speed of light, and nearing c, additional acceleration takes exponentially more force. So we can safely assume that 2.59 × 10⁸ m/s is a good high-end number for the implosion speed of any main sequence star. If both the initial mass and the initial implosion speed have upper limits (i.e., 1.4 solar masses @ the speed of light), then there is an upper limit to the kinetic energy store that will be created, and we're already near it. So the first round of calculations will use these initial conditions:
mass: 1.99 × 1030 kg (1 solar mass) velocity: 2.59 × 10⁸ m/s (86.38% c) energy: 6.67 × 1046 J (resulting energy store) temp: 22,000 K (temperature of Bellatrix) Next we need to quantify the power output. The absolute luminosity (in watts) is tough to determine without knowing the precise distance to the star in question, so the luminosity is typically derived from the temperature using the Stefan-Boltzmann Law. But we have to make an adjustment for the fact that Bellatrix is 35 times more luminous than it would be if it had the same surface area as the Sun (just at a higher temperature). In the standard model, this is taken as evidence that Bellatrix's surface area must be 35 times greater than the Sun's. But even the Sun is more luminous than it's supposed to be — given its observable 5525 K blackbody temperature, and its surface area of 6.08 × 10¹⁸ m2, the total power output should be 3.15 × 1026 watts, which is only 82% of the actual 3.86 × 1026 watts. The CFDL model introduces the possibility that the Stefan-Boltzmann Law can only be taken at face value for blackbody surfaces, while plasmas are volumes, and the luminosity is going to be a function of the temperature4 × the surface area × the effective depth of the radiator. In the CFDL model, this depth increases with temperature, making hotter stars far more luminous than expected, and cooler stars not that much more luminous.
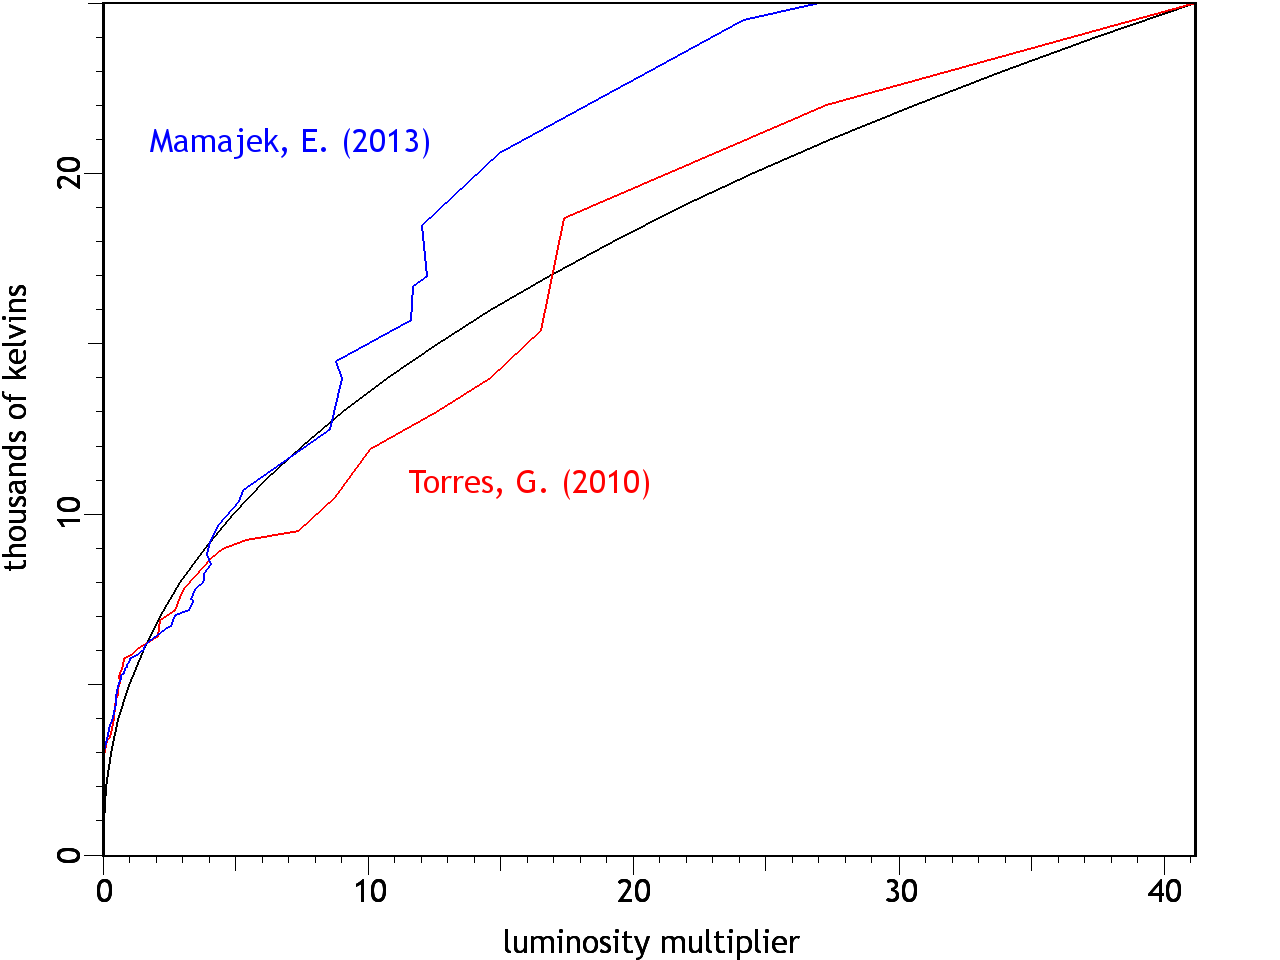
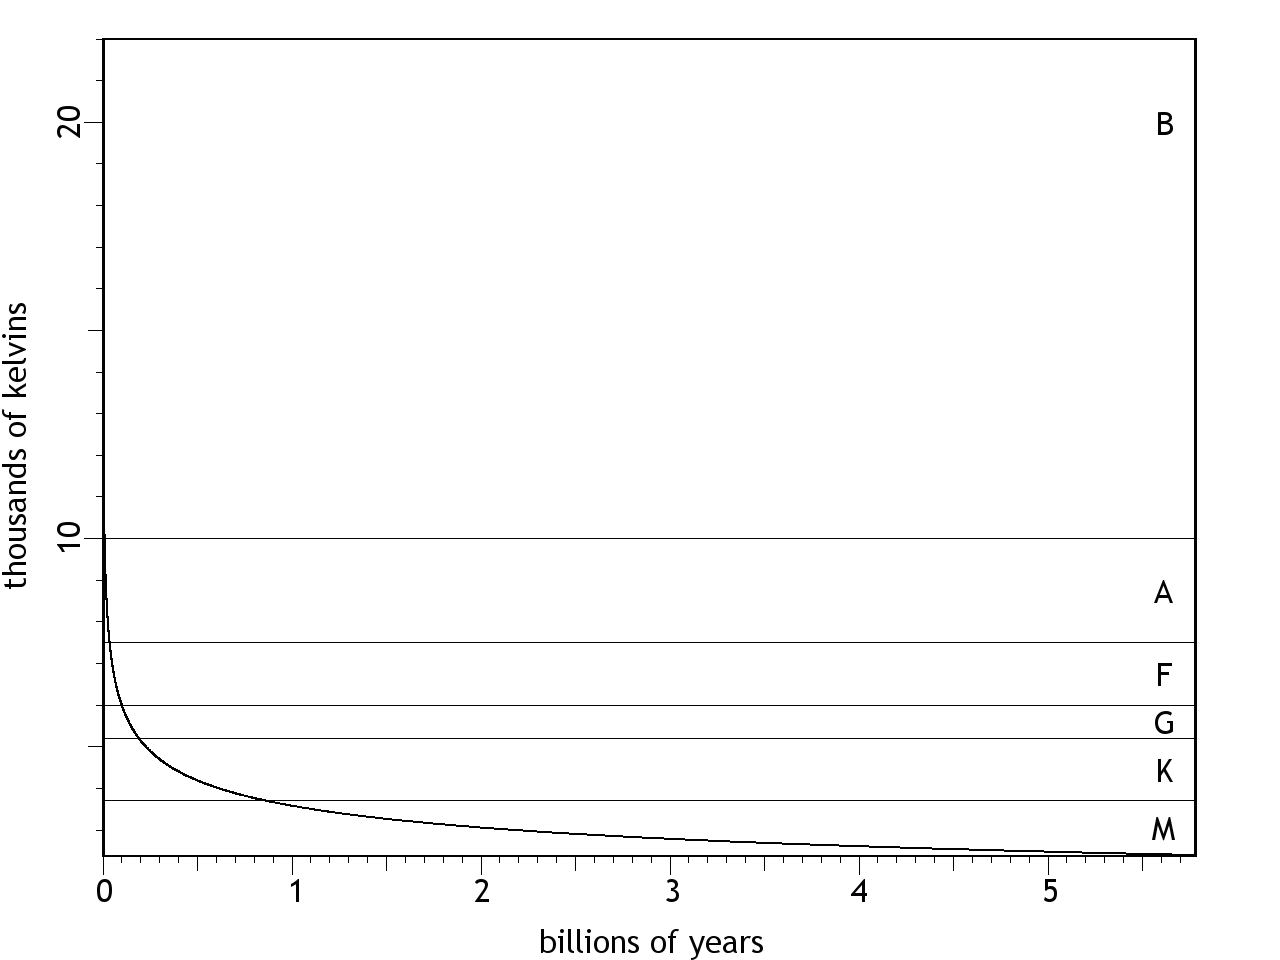
P = eσAT4 × ((T / 104)2.3219 × 4.905) where: P = total radiated power (watts) e = emissivity (=1 for BB radiators) σ = A = radiating area (m2) T = temperature (K) Observations of stars where we have good estimates of the distances from us, enabling accurate estimates of the absolute luminosities, reveal that the enhanced luminosity of hotter stars isn't consistent, and there is no universally acknowledged formula for relating temperature to luminosity — sometimes researchers calculate it different ways even in the same paper.2 The CFDL model attributes such variations to differences in the near-surface electric fields, which alter the degree of ionization in the plasma, and therefore the opacity. Also, the elemental abundances vary from one star to the next, and each element has its own set of ionization potentials. But for our purposes, we need a rule that can be applied consistently to all of the calculations. We could interpolate between the luminosity values of known stars, but the same star isn't going to undergo changes in elemental abundances so that it can hit known luminosities. So a fit curve was found that approximates the observations. The formula for the correction is: ((T / 104)2.3219 × 4.905). The smooth curve in Figure 1 shows the values produced through the relevant temperature range. This gets the solar output right (factor = 1.224 @ 5500), and at the same time, gets the luminosity of Bellatrix to be 35 times greater than its temperature warrants (factor = 30.600 @ 22000). The colored lines show the irregularity of the observed luminosities, as reported in two separate studies, the shorter/steeper of which was the more recent.3,4,5 The principle interest in this article is with stars cooler than 10,000 K where the deviations are not so worrisome.Figure 1. Bolometric correction used in this article, to correlate stellar temperature with absolute luminosity. The smooth curve obeys: ((T / 104)2.3219 × 4.905).Lastly, the appropriate method for calculating radiative heat loss should be considered. Since luminosity varies with the fourth power of the temperature, the power output (and thus the heat loss) is much greater at higher temperatures. Thus the cooling over time will not be linear — it will be a curve, with rapid cooling at first, and with the heat loss leveling off with time, asymptotically approaching absolute zero at an infinite time from now. The simplest way to calculate such non-linear heat losses is with iterative code. At the starting temperature, the star loses a certain number of joules/second to the luminosity that it is issuing. But after a year has passed, the temperature will have dropped, and the star won't be shining as brightly, which means that it won't be losing heat as fast. To calculate the heat loss for the next year, we have to step down the heat loss rate. If we make the time intervals small enough, the step-wise adjustments won't have a noticeable effect on the results. It also helps to use logarithmic time intervals, with short steps at first, as the temperature is falling rapidly and the error could be large, while the intervals can be greater as the curve levels off.The results of the calculations with all of these factors taken into account are surprisingly short stellar life cycles. (See Figure 2.) When starting at 22,000 K (i.e., the surface temperature of Bellatrix), the star depletes its kinetic energy store quite rapidly, evolving into a red dwarf (M class) in less than a billion years. And it only spends about 200 million years as an F/G class star.Figure 2. Radiative heat loss, starting at 22,000 K. The letters on the right side denote the spectral classes for those temperatures.Is there any way to double-check these numbers?If all stars begin at the same temperature, but at random times, and if they cool at a predictable rate, we should see specific quantities of stars at each stage of the cooling process. If the cooling were linear, we'd expect the same number of stars at each temperature, while logarithmic cooling will leave few hot stars and many cool ones. We can then compare these expectations to the observations of large populations of stars.
Table 1. Properties of Main Sequence Stars
class temperature luminosity percent
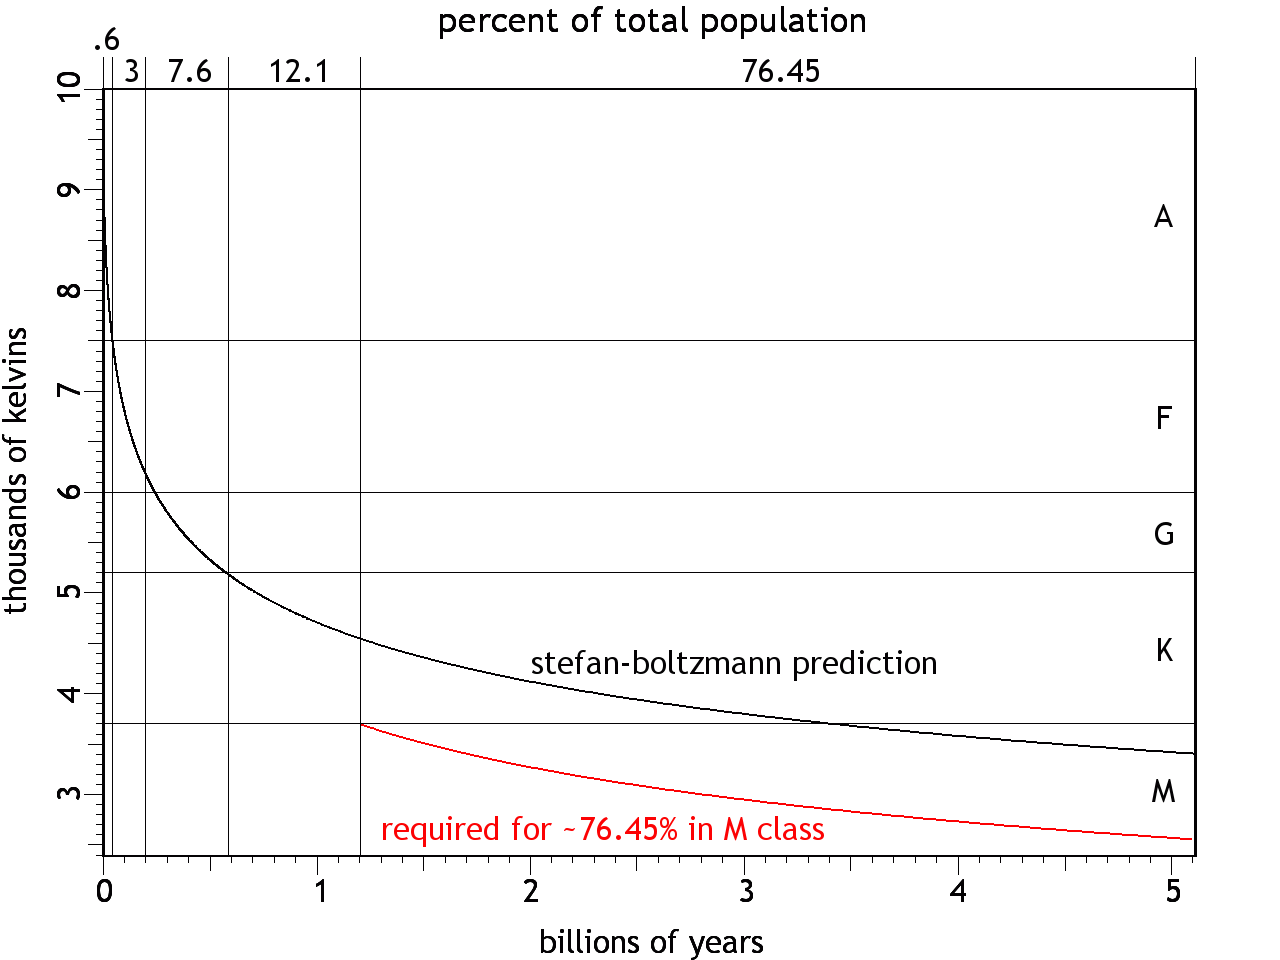
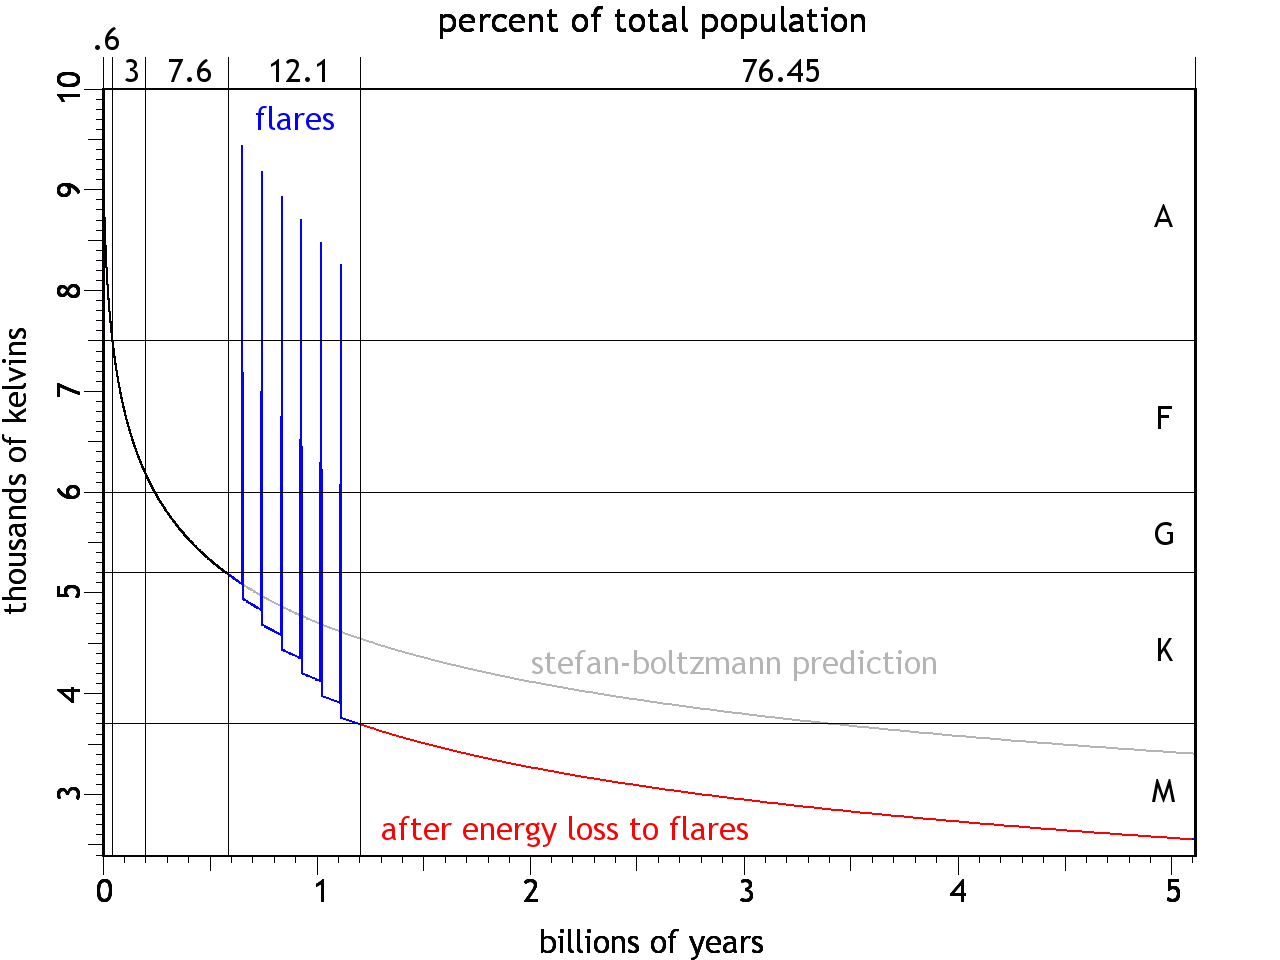
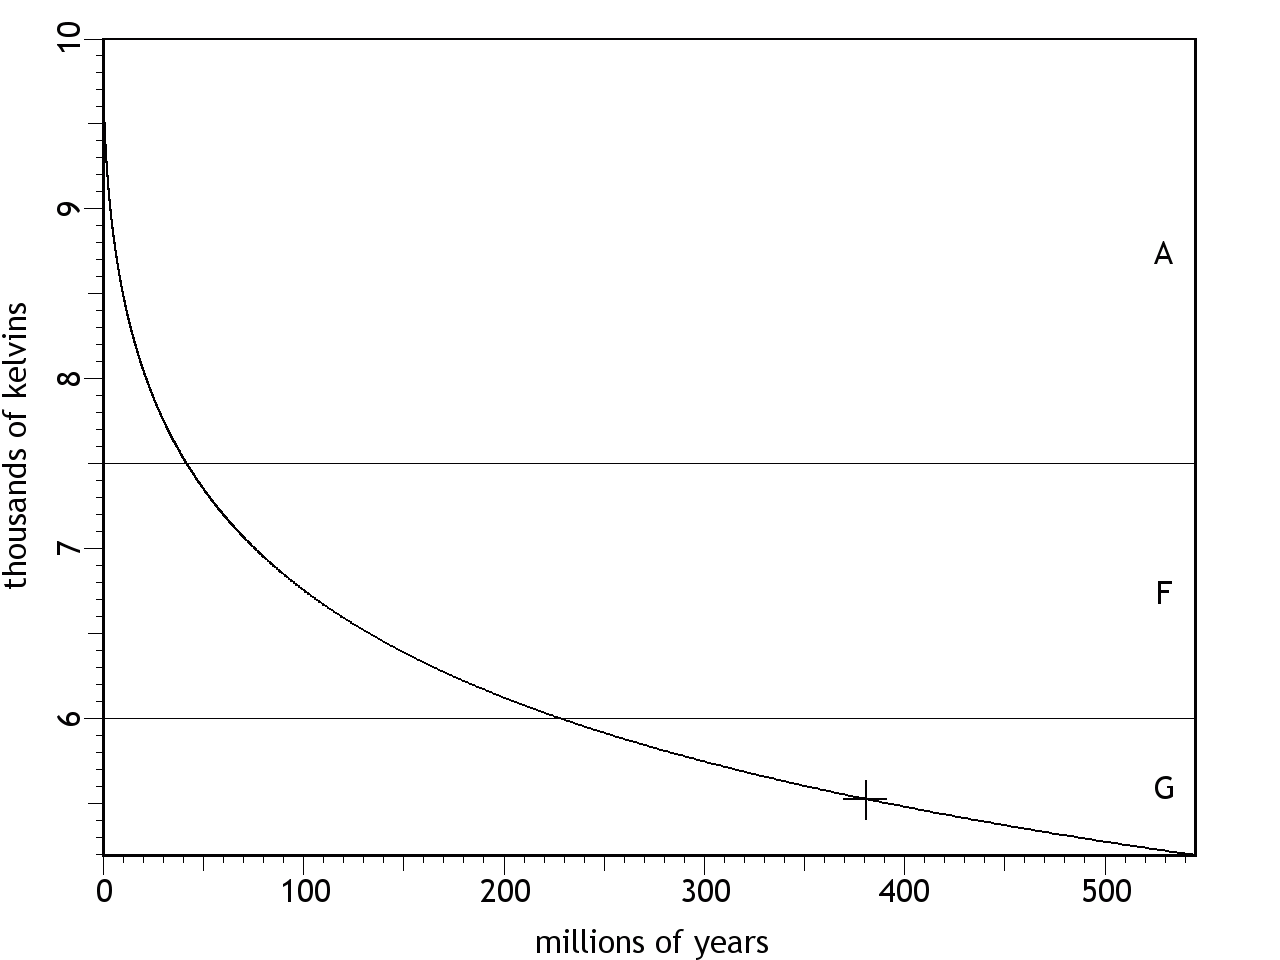
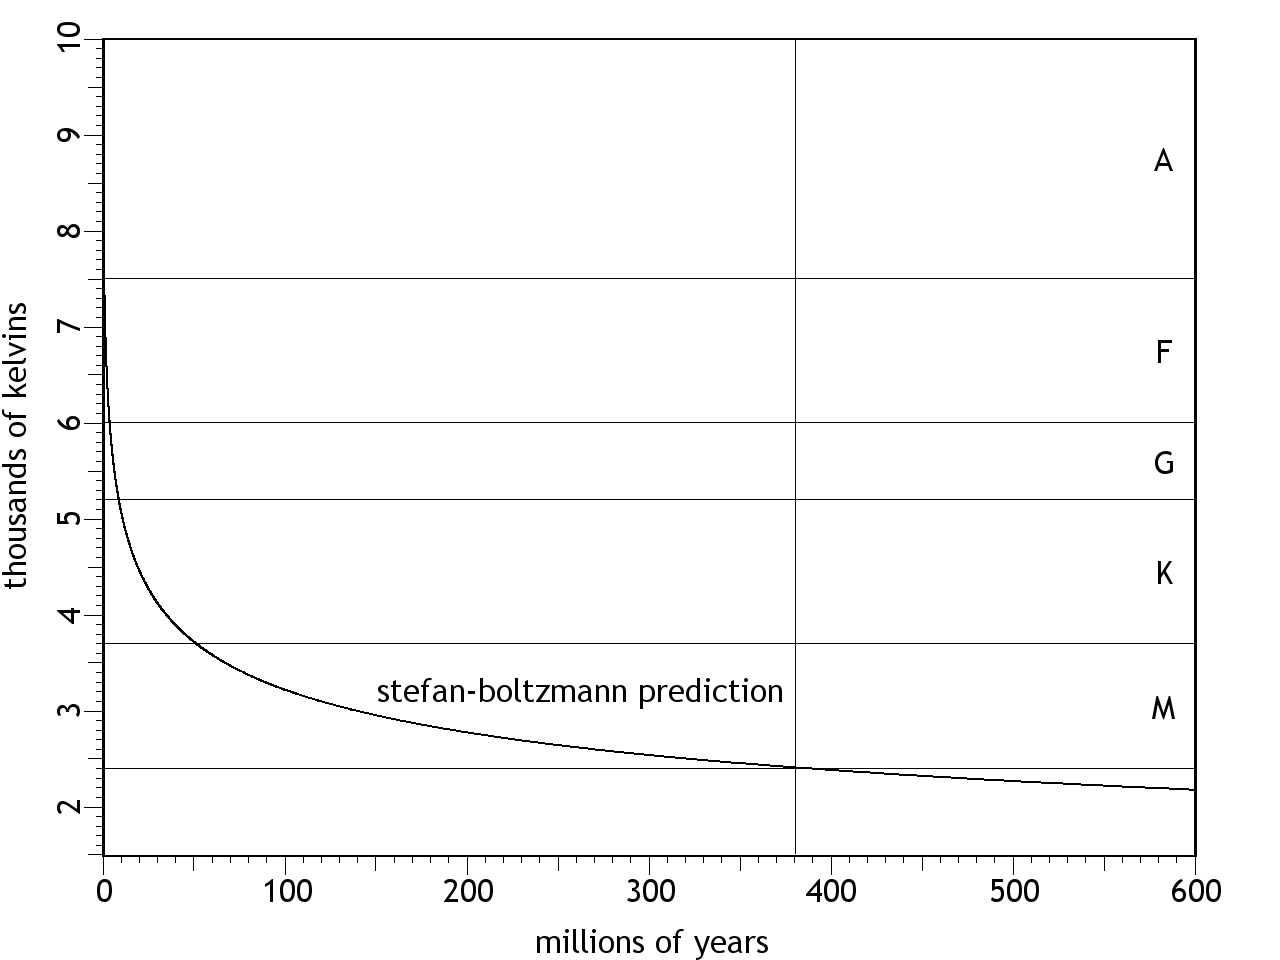
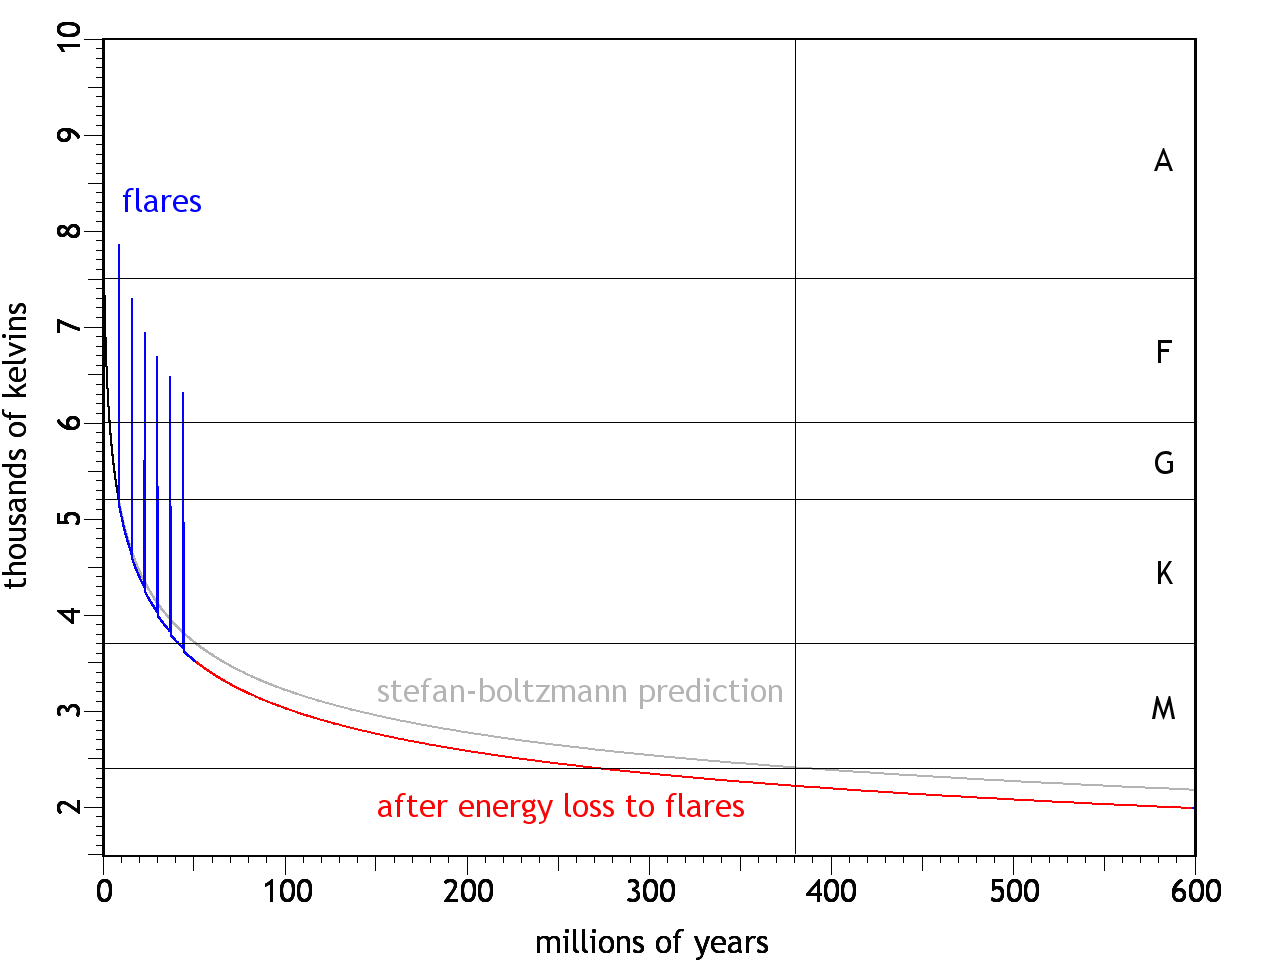
of totalmin max min max O 30,000 ∞ 30,000 ∞ 0.00003 B 10,000 30,000 25.00 30,000 0.13 A 7,500 10,000 5.00 25.00 0.60 F 6,000 7,500 1.50 5.00 3.00 G 5,200 6,000 0.60 1.50 7.60 K 3,700 5,200 0.08 0.60 12.10 M 2,400 3,700 0.00 0.08 76.45 The "percent of total" column in Table 1 has the data we need for each spectral class. Immediately we see that the O/B stars (such as Bellatrix) are so rare as to be statistically insignificant, which we should therefore neglect. They might even be artifacts of observational error. For example, if two or more stars happen to fall precisely along our line of sight, they will be impossible to isolate. Furthermore, the light from the more distant star will get refracted by the atmosphere of the nearer star. Since high frequencies are more susceptible to refraction, the combined light from the two stars will be bluer. Trying to get stellar theory to account for this, assuming that it's a single star, might be inappropriate. So we should focus on the more reliable data from the A, F, G, K, and M classes.Figure 3 shows a curve beginning at 10,000 K (i.e., the top of the A class). When starting at that temperature, the proportions of stars in the A, F, & G classes (0.60% : 3.00% : 7.60%) are a good fit. And had the curve passed through the K/M boundary at 1.2 billion years (as shown in the colored curve), the proportion of M class stars (76.45%) would have been about right. But the curve should have only spent 12.1% of its time in the K class, and it misses that mark by over 2 billion years.Figure 3. Radiative heat loss starting at 10,000 K, with stellar populations in each spectral class noted along the top.The discrepancy in the K class isn't necessarily a bad thing — it might be the expected result of excessive flares common in the K class, which for short periods of time increase the temperature to well over 10,000 K,6 thereby greatly increasing the heat loss rate. So the actual curve might show spikes in temperature due to flares, and step-wise cooling after the spikes. Over the course of 600 million years, this will happen tens of millions of times. Figure 4 represents the flares schematically with just a few spikes, and with immediate reductions in temperature thereafter, with the net effect of shifting the rest of the light curve downward, ultimately entering the M class at 1.2 billion years. The flares can continue on into the M class, so hitting the target of 2400 K at an age of 5.11 billion years isn't unrealistic (i.e., such that the M class stars would comprise 76.45% of the total).Figure 4. Same as Figure 3, but with megaflares accelerating the cooling through the K class, shifting the light curve down to the lower track.The implications of these results haven't been fully explored. In general, shortening the time-frame for astrophysical processes requires simply that everything run faster, and if no part of the model had already stipulated a specific span of time for a specific process, there won't be any theoretical problems. Such is pretty much the case with the CFDL model so far — this is the first set of physical limits on the life cycle of main sequence stars, and dates elsewhere in this body of work can be compressed to suit these results without breaking anything. But it should be noted that the shortened time-frame lends credence to the extreme amount of kinetic energy that goes into a star in the CFDL model. The Energy Budget section concluded that the Sun was endowed with 6.67 × 1046 joules, from its mass of 1.99 × 1030 kg being accelerated to 2.59 × 10⁸ m/s (i.e., 86.38% the speed of light) during the implosion of the dusty plasma. That's a very high speed. But at a lesser speed, even less kinetic energy would have been developed, resulting in a smaller energy store, and an even shorter life cycle (assuming the same initial temperature of 10,000 K as required by the stellar population statistics). Too much shorter and it starts to get difficult to imagine how the solar system could have achieved its present maturity so quickly. So the energy budget, as stipulated, seems to be required in full.Outside of the scope of the present work, but nevertheless worth mentioning, is that there might be an interesting relevance to the study of the conditions in which life evolved on Earth. In the standard model, the Sun was born 4.5 billion years ago, and has been burning steadily ever since. The Earth was formed at the same time, but underwent some sort of transformation 4.1~3.8 billion years ago, since no rocks older than that have been found.7 (See the section on Remelted Crusts.) Once the crust reformed, the temperature stabilized, and life became possible, with single-celled organisms appearing as early as 3.5 billion years ago,8,9 and with complex organisms firmly established 500 million years ago. But the present article estimates the Sun to be only 381 million years old. (See Figure 5.)Figure 5. Radiative heat loss, starting at 10,000 K. At 5525 K, our Sun would be just 381 million years old.How could radiometric dates be older than the very existence of the Earth? The answer is that they neglect differences in the radioactive decay rates depending on temperature.10,11 The standard model assumes that the Sun has maintained the same temperature for its entire life,12 and that the Earth's crust that solidified 4.1 billion years ago has been at 300 K the whole time. But it's more likely that the crust cooled slowly, and thus the radioactive decay rate would have run faster, thereby falsely reporting a greater age. And what we're seeing here is the possibility that the Sun was also producing a lot more heat. Thus life evolved in a much shorter period of time, and in an environment that was much warmer. It should also be noted that the hotter Sun was producing more high frequency (ionizing) radiation, which would have increased the mutation rate.Since the present model incorporates the hypothesis that the Earth was also once a star,13 we can apply the same analysis to it. If the Sun and the Earth formed at the same time, from the same imploding dusty plasma, perhaps the velocity of the plasma was the same for both, in which case the particle kinetic energy (which we're calling temperature) would have been the same. The total kinetic energy would have been different, because of the vast difference in mass. But the light curve will still obey the same principles, just with a smaller energy store being depleted through a smaller surface area. (See Figure 6.)Herein we find another discrepancy. The Earth's estimated average internal temperature right now is 2221 K. In Figure 6 we see that it should hit this temperature at the age of about 549 million years. But if the Sun and the Earth are only 381 million years old, the Earth's average temperature at that age should be 2413 K, or 192 K hotter than it actually is. Perhaps the Earth went through a flaring stage in the K class, which left it cooler than would otherwise be expected. (See Figure 7.) It's also possible, as some researchers believe, that the Earth was stripped of its atmosphere by a huge solar flare, such as a T Tauri event, which has been observed happening to exoplanets.14 Since the atmosphere is the hotter aspect of the planet, losing it reduces the average temperature of what's left.Figure 7. Earth's light curve, with extra cooling during the K class due to flares, leaving the average temperature at 2221 K at the age of 381 million years.Even with the 192 K discrepancy, it's significant that the Earth has come this close to hitting the expected temperature at 381 million years using the same heat loss calculations as were used for the Sun.So the tentative conclusions that can be drawn from the present analysis are that the Sun and the Earth are a lot younger than in the standard model, that life evolved much more rapidly, in a much warmer environment, and with a lot more ionizing radiation from the Sun. Whether or not the radiometric dates would fall in line with these numbers, once recalibrated with faster radioactive decay at the higher temperatures, remains to be determined.And what of our future?The standard model has the Sun evolving into a red giant ~5 billion years from now.15,16,17 In the CFDL model, the red giant phase occurs at the beginning of the stellar life cycle, not at the end. As the dusty plasma implodes, it begins issuing visible radiation when the compression has increased the temperature to a few thousand kelvins, though the matter is still quite diffuse at that point, hence the "gigantic" nature of such a star. After it forms, the star gradually cools down, asymptotically approaching absolute zero. But this does not mean that the cooling is entirely steady — when the Sun gets into the K class at an age of ~545 million years (~170 million years from now), megaflares will bring dramatic differences in temperature. Perhaps the oceans will be boiled away, making it hard to imagine how life of Earth could persist. Past the K class, the heat loss will stabilize. Water vapor will condense back to a liquid. Whatever life forms that survived the megaflares will then have to adjust to a slowly cooling environment, until eventually, everything will freeze over, and unless the life forms can generate their own heat, they will expire. Perhaps that would be a good time to move to Venus, which would then be at a more habitable temperature.
1. Janson, M. et al. (2011): High-contrast Imaging Search for Planets and Brown Dwarfs around the Most Massive Stars in the Solar Neighborhood. arXiv ⇧
2. Mamajek, E. (2015): Absolute and apparent bolometric magnitudes for the Sun and stars. ⇧
3. Flower, P. J. (1996): Transformations from Theoretical Hertzsprung-Russell Diagrams to Color-Magnitude Diagrams: Effective Temperatures, B-V Colors, and Bolometric Corrections. The Astrophysical Journal, 469: 355 ⇧
4. Torres, G. (2010): On the use of empirical bolometric corrections for stars. ⇧
5. Pecaut, M. J.; Mamajek, E. E. (2013): Intrinsic Colors, Temperatures, and Bolometric Corrections of Pre-main-sequence Stars. The Astrophysical Journal Supplement Series, 208 ⇧
6. AAVSO (2016): UV Ceti and the flare stars. ⇧
7. Bowring, S. A.; Williams, I. S. (1999): Priscoan (4.00–4.03 Ga) orthogneisses from northwestern Canada. Contributions to Mineralogy and Petrology, 134 (1): 3-16 ⇧
8. Schopf, J. W. et al. (2002): Laser–Raman imagery of Earth's earliest fossils. Nature, 416: 73-76 ⇧
9. Schopf, J. W.; Kudryavtsev, A. B.; Czaja, A. D.; Tripathi, A. B. (2007): Evidence of Archean life: Stromatolites and microfossils. Precambrian Research, 158 (3-4): 141-155 ⇧
10. Curie, P.; Onnes, M. K. (1913): Sur le rayonnement du radium à la température de l'hydrogène liquide. Journal de Physique: Le Radium, 10 (6): 181-186 ⇧
11. Emery, G. T. (1972): Perturbation of Nuclear Decay Rates. Annual Review of Nuclear Science, 22: 165-202 ⇧
12. Ribas, I. (2009): The Sun and stars as the primary energy input in planetary atmospheres. arXiv, astro-ph: 0911.4872 ⇧
13. Wolynski, J. (2012): The General Theory of Stellar Metamorphosis. ⇧
14. Vidal-Madjar, A. et al. (2004): Detection of Oxygen and Carbon in the Hydrodynamically Escaping Atmosphere of the Extrasolar Planet HD 209458b. The Astrophysical Journal Letters, 604 (1): L69 ⇧
15. Redd, N. T. (2016): Red Giant Stars: Facts, Definition & the Future of the Sun. space.com ⇧
16. Schroder, K.; Smith, R. C. (2008): Distant future of the Sun and Earth revisited. arXiv, astro-ph ⇧
17. Smith, N.; Hinkle, K. H.; Ryde, N. (2008): Red supergiants as potential Type IIn supernova progenitors: Spatially resolved 4.6 micron CO emission around VY CMa and Betelgeuse. arXiv, astro-ph: 0811.3037 ⇧


