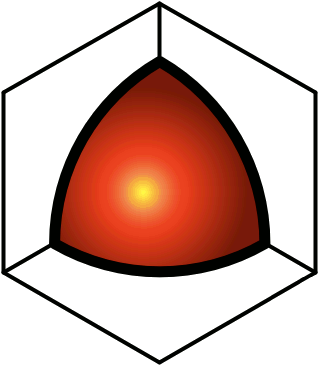
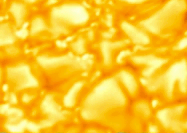
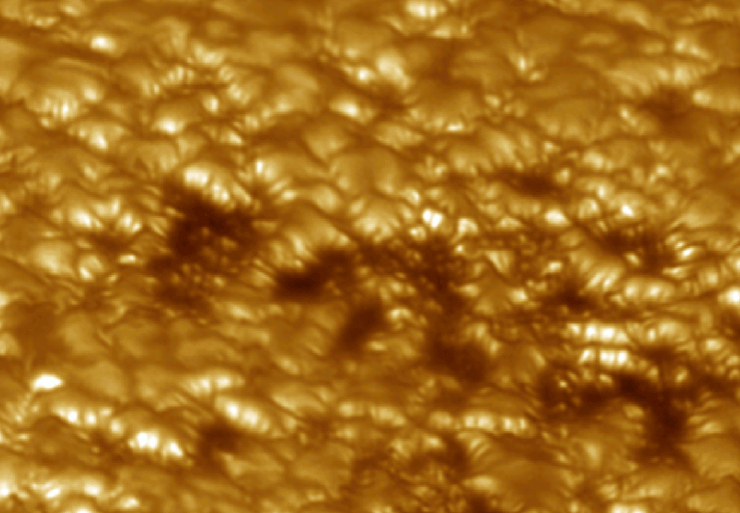
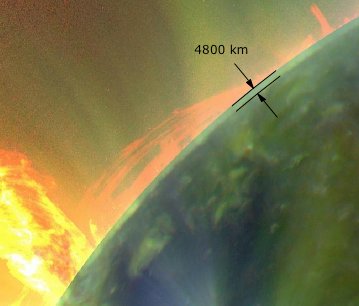
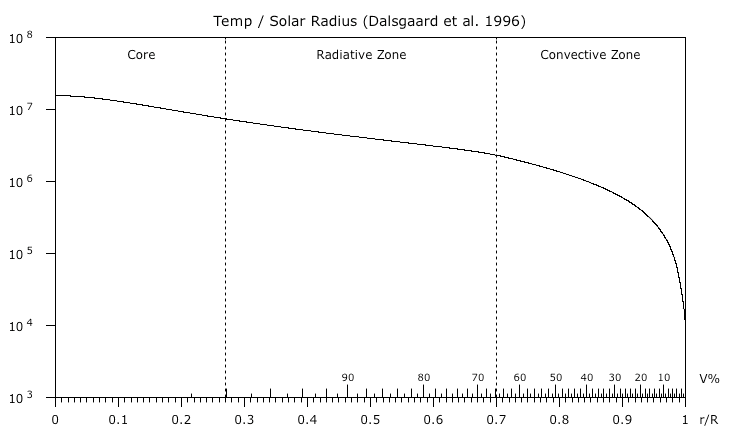
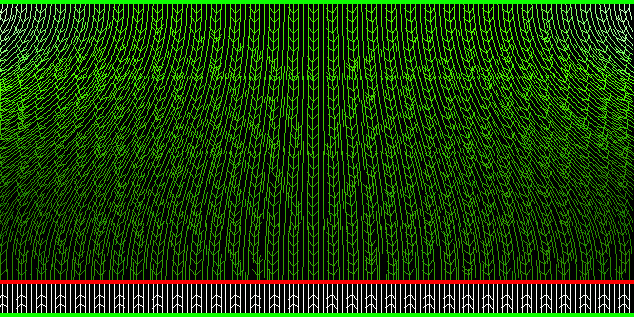
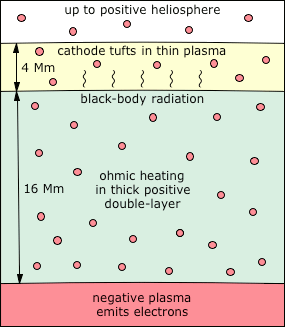
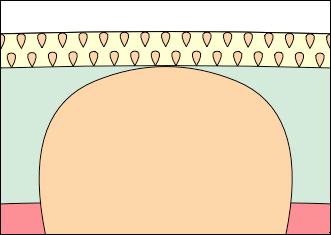
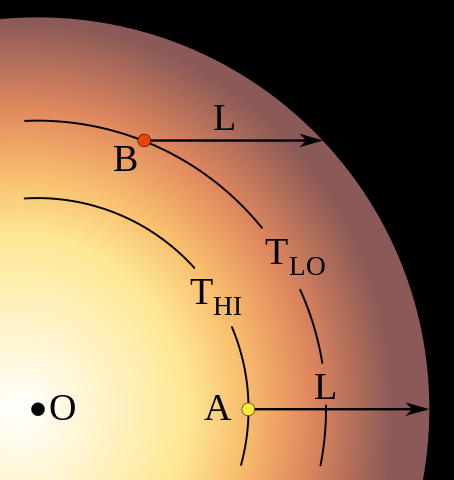
© Charles ChandlerThe Surface section identified some of the visible characteristics of the Sun, which necessitated current-free double-layers (CFDLs), which themselves required elaboration. Now that this model has been fleshed out, we can go back and make a more detailed analysis of the surface.As mentioned earlier, the surface of the Sun is covered in granules. (See Figure 1 or Figure 2.) These have the appearance of convective cells erupting onto the surface. The updrafts in the center average 2 km/s, and the downdrafts around the outsides can exceed 7 km/s.1 But these are supersonic speeds for the 6,000 K hydrogen,2 and while we don't know for sure the depth at which the updrafts began, and thus we don't know how long they had to accelerate, we do know that at the top, the plasma splays out and is accelerated to 7 km/s in the downdrafts, and this is in the plasma that is still visible (i.e., very near the surface). It's hard to imagine how negative buoyancy could accomplish this instantaneous acceleration. And if we take a closer look, the question gets even harder to answer. The intergranular lanes, with the (supposedly) cooler plasma that is falling at 7 km/s due to negative buoyancy, has streaks of even hotter plasma, called faculae.3,4 (See Figure 3 or Figure 4.) Hotter plasma is not negatively buoyant, much less hypersonically so.Figure 3. Close-up of the solar surface, 2002-07-24, showing faculae on the near edge of many of the granules.Clearly, forces other than just buoyancy are at work here. So we'll examine granules in the context of the EM model, to see if they don't make more sense that way. To start, we should make what inferences we can about the 3D structure.The granules are typically 1 Mm across. If they originate from a depth that is 4 times greater than their width, the granular layer is 4 Mm deep. This dimension can be confirmed, at least indirectly, in two ways. First, near-surface helioseismology of sunspots (covered in more detail in the Sunspots section) shows updrafts in the sunspot shafts beginning 20 Mm below the surface, and ending at 4 Mm. (See Figure 5.) The granular recirculation was thus shown to be a totally different type of flow that occurs only in the topmost 4 Mm.Figure 6. The Sun in a composite of different wavelengths taken on 2010-03-30. Iron is shown in green.© 2010 SDO/AIASecond, we should consider Figure 6, and one of the possible interpretations. This was the first image taken by SDO. The scientists were so excited to have caught a CME in the first shot that they released the image without any post-processing. On closer scrutiny, we see a curious thin layer at the top, 4.8 Mm deep, that has no business being there in the standard model. Trusting their model and not the initial calibration of the filters based on the known dimensions of the Sun, the filters have since been adjusted to not show a saturation drop-off at depth. But a 4.8 Mm error, on an object with a 696 Mm radius, is nearly 1% off. It's a bit hard to believe that the engineers who lined up the filters for the first shot would have been that sloppy. It's possible that the initial calibration was correct, that the standard model is wrong, and that there is, in fact, a ~4 Mm layer at the top that is much thinner than the underlying plasma.Note that none of these forms of data are terribly conclusive. But they are the only data we have, they all say the same thing, and there are three sets: the aspect ratio of thermal bubbles, the sub-surface flows under sunspots, and the imagery taken with geometrically calibrated filters. Until data are collected that can invalidate these, in a theory-independent way, these are the data that will be used. So the tentative conclusion is that the granules occur in a layer that is ~4 Mm deep, and that the underlying plasma is much denser.The standard model is even harder-pressed to explain this double drop-off (i.e., one at a depth of 4 Mm, and the other at the surface). It was originally thought that convection was the primary heat transport mechanism in the topmost 210 Mm of the Sun, hence it was named the "convective" zone. But recent research has shown that deep convection can only account for less than 1/20 of the power emanating from the surface.5 Thus radiation and conduction are the primary transport mechanisms in the "convective" zone. Then, looking at Figure 7, we can see that from the core, the temperature decreases more or less steadily to near the surface, while above .9 R⊙ (70 Mm below the surface) the fall-off accelerates, as a consequence of heat loss at the surface. So the convection should begin at a depth of 70 Mm, not 210 Mm, and not 4 Mm.This all makes a lot more sense if we use the density gradient in the present model. (See Figure 8.) The density of the hydrogen layer is maintained to very near the surface, since it is a positive double-layer being held down forcefully by an underlying negative layer. Then we just have to come to understand the eruption of convection in the topmost 4 Mm.This is explained by the action of the electric current. There is a flow of electrons from the negative layer up through the topmost 20 Mm of positive plasma. These electrons start out moving slowly, and accelerate as they go. The reason is that they begin at a current divider where there is an ambiguous electric field. Below, there is a strong positive charge in the liquid helium & hydrogen layer. This holds down the bulk of the electrons. At the top of the negative layer, the downward force is weak, as electrons are shielded from the underlying positive charge by the negative charge in their own layer. In the other direction, there is the positively charged heliosphere. Somewhere in the negative layer the net force is nothing, and the electrons are stationary. Above that level, electrons are free to flow outward toward the heliosphere, but the electric field is weak at first. The further they get from the current divider, the less ambiguous the electric field, and the greater the acceleration.Figure 9. Lines of force in a tripolar field. Green = positive; red = negative. The arrows show direction of force on a positive charge. Brightness of lines indicates field density.Figure 10. The topmost 20 Mm of the Sun, with 16 Mm of dense plasma, and 4 Mm of thin plasma at the very top.Due to the acceleration, the ohmic heating in the topmost 20 Mm increases in the direction of the flow of electrons. The density of the plasma also decreases. At some point, the increasing heat and decreasing pressure result in the eruption of thermal bubbles. As mentioned above, their 1 Mm width suggests that this transition occurs at a depth of ~4 Mm. (See Figure 10.) Below that depth, densely packed plasma generates blackbody radiation. In the topmost 4 Mm, the loosely packed plasma in the granules is cooler, and is responsible for the absorption lines in the solar spectrum (per Kirchhoff's 3rd law).And in this context, we can understand supersonic updrafts and downdrafts. All matter has at least some degree of electrical resistance. Normally we only care about the effects of this resistance on the flow of electrons through the resistor, but the equal-but-opposite effect is that the resistor itself has a force applied to it. As concerns electric currents flowing through wires, the wire itself is pulled in the direction of the current, with a force equal to the electrical resistance. In a decent conductor that is well-fastened at both ends, the force is negligible, and never mentioned. In a plasma, it's not really electrical resistance per se, but more a matter of the Newtonian forces of high-speed electrons bombarding atoms in their way. The effect on the atoms is called "electron drag," and it accelerates the atoms in the direction of the electrons.6:806 Normally the effect is small, and in the present model, the current density is weak. With a total of 2.93 × 10¹⁵ A, divided by the surface area of the Sun (i.e., 6.09 × 10¹⁸ m2), that comes out to 5.40 × 10⁻⁴ A/m2. But this current acts on the plasma through the entire depth of the granular layer (~4 Mm), and the ionized plasma is virtually frictionless. So electron drag really only has to overcome the inertial forces in the plasma to accelerate it to supersonic speeds. Yet ultimately, the more powerful force operating on the positive ions is their electrostatic attraction to the negative electrode. So when the bubbles hit the surface, the electrons are free to stream out into space, and the positive ions are pulled back into the Sun at up to 7 km/s. In engineering terms, this "convection" is called cathode tufting.7,8So why are the sides of granules brighter? When viewed perpendicular to the surface, the sides are darker. This is what led researchers to believe that the sides are cooler. That fit nicely with the expectation of convective cells, wherein the downdrafts around the outside would be falling because of negative buoyancy. But this neglects what it does not expect, in the bright streaks known as faculae. This is evidence of enhanced electric currents through the outsides of the granules. They look darker on the perpendicular, not because they're cooler, but rather because the emissions are synchrotron radiation from Birkeland currents, which are directional, and do not project in the direction of the axis of the currents. (See Figure 11.) The current is greater where the charges are counter-streaming, because the increase in temperature reduces the resistance. This is consistent with the enhanced magnetic fields associated with faculae, and with the emergence of spicules above them.9Figure 12 compares granules in the topmost 4 Mm to supergranules that originate from a depth of 125 Mm. The supergranules stop at the 4 Mm depth, since the granular layer is a surface condition that has nothing to do with convection in the underlying plasma. It's useful to think of the supercritical fluid below 4 Mm as a liquid that we can't see, but with a thin layer of flames on top that we can. A bubble in the liquid will elevate the surface condition, even without otherwise affecting it.Note that this model offers a fundamentally new conception of the photosphere (i.e., the sphere from which all photons emanate). In the standard model, the topmost ~.7 Mm is transparent (except for some absorption lines), so by the time the photons generated in the core reach ~.7 Mm below the surface, all of the transformations, from gamma rays to 5500 K blackbody radiation, have already occurred. In the present model, the topmost 4 Mm is transparent, and the blackbody radiation is coming from the supercritical fluid below 4 Mm, down to a depth of 20 Mm, which are the extents of the positive double-layer in which ohmic heating is occurring.And this enables the assimilation of even more data. If we take a closer look at the actual blackbody curve, we see an anomalous overshoot in the blue band. (See Figure 13.)The reason for this is that the spectrum is actually a blend of BB curves from plasma at different temperatures. The light that we receive from the edge of the Sun is 4600 K, while normal to the surface it's 6400 K.10,11 (See Figure 14.) Hence the 5525 K fit is actually just an average of temperatures that vary from 4600 to 6400 K.Figure 15. The standard model of limb darkening. The outer boundary is the radius at which photons emitted from the star are no longer absorbed. L is a distance for which the optical depth is unity. High-temperature photons emitted at A will just barely escape from the star, as will the low-temperature photons emitted at B. Note that for a typical star, this drawing is not to scale. For the Sun, L would be only a few hundred km.© 2019 WikipediaThis so-called "limb darkening" is explained in the standard model as the consequence of limb light originating from a shallower depth, where the temperature is lower. (See Figure 15.) Herein the standard model marshals the data with the principles of a blackbody radiator, which would indeed vary its color, directly & smoothly, by its temperature. And yet when pressed on the matter, the standard model explains solar radiation as a pseudo-BB curve, in that it is an aggregate of just so many spectral lines, which definitely would not vary directly, or smoothly, from one depth to another — as the temperature varies, so does the degree of ionization, but the frequencies emitted by electron uptake are dictated electron shells, and the intensity at that frequency comes from the number of identical events across the viewing area. There is no reason for the intensities per frequency to follow a BB curve. If it happened once, it would be an odd coincidence, but for the intensity per frequency to vary continuously, from 4600 to 6400 K, there would have to be a continuous array of odd coincidences, which would be that much harder to believe. And that's on top of the fact that the standard model has 6400 K being achieved at just .048 Mm below the surface, where the density is just 2.52 × 10⁻⁴ kg/m3, which is four orders of magnitude thinner than STP air (i.e., 1.29 kg/m3), and which is far too tenuous to absorb/emit 5525 K BB radiation.In the present model, the BB radiation is generated by oscillating supercritical hydrogen nuclei. Given the high thermal conductivity of supercritical fluids, we'd expect little variation in particle speeds, even going deeper into the Sun. But the mean free path will change, under gravitational loading, and more significantly, with proximity to the underlying negative charge. These forces will compact the matter, and a particle traveling at the same speed will vibrate at a higher frequency due to the shorter mean free path. This means that the difference in BB "temperature" is an index of pressure, not the kinetic energy of the particles. Analogously, if a guitar string is plucked, and while it's still vibrating, the tension on the string is increased, the frequency will increase, and without adding more energy to make it so.It's also significant to note that in this model of blackbody radiation, "hotter" light can shine through thinner plasma. The high-frequency photons from high-pressure plasma will not get absorbed by low-pressure plasma, which cannot resonate at such high frequencies. So the source of the 6400 K radiation can be much deeper than just ~4 Mm. Nevertheless, atomic vibrations are random, so there is still some absorption, and limb darkening is still possible in this model.
1. Hathaway, D. H. (2012): Photospheric Features. NASA/Marshall Solar Physics ⇧
2. Kennewell, J.; McDonald, A. (2012): The Solar Photosphere. IPS Radio and Space Services ⇧
3. Zhao, H. et al. (2002): Activity Cycle of Polar Faculae. Publications of the Astronomical Society of Japan, 54 (5): 787-792 ⇧
4. Hagino, M.; Sakurai, T.; Miyazawa, A. (2003): Activity Cycle of Polar Faculae. The Solar-B Mission and the Forefront of Solar Physics, 325 ⇧
5. Hanasoge, S.; Duvall Jr, T. L.; Sreenivasan, K. R. (2012): Anomalously Weak Solar Convection. arxiv.org, 1206.3173 ⇧
6. Hantzsche, E. (2003): Mysteries of the Arc Cathode Spot: A Retrospective Glance. IEEE Transactions on Plasma Science, 31 (5): 799-808 ⇧
7. Compton, K. T.; Langmuir, I. (1930): Electrical Discharges in Gases. Part I. Survey of Fundamental Processes. Reviews of Modern Physics, 2 (2): 123-242 ⇧
8. Langmuir, I.; Compton, K. T. (1931): Electrical Discharges in Gases Part II. Fundamental Phenomena in Electrical Discharges. Reviews of Modern Physics, 3 (2): 191-257 ⇧
9. Beckers, J. M. (1964): On the Relation Between Solar Granules and Spicules. The Astrophysical Journal, 140: 1339 ⇧
10. Freedman, R. A.; Kaufmann, W. J. (2008): Universe, Chapter 16 (8th Edition). W. H. Freeman & Company, 414-428 ⇧
11. Neckel, H.; Labs, D. (1994): Solar limb darkening 1986-1990 (lambda lambda 303 to 1099nm). Solar Physics, 153: 91-114 ⇧
