home


Cycles
© Charles Chandler
 
Lastly we will challenge the present model to explain the solar cycle. There are a lot of data, because the cycle is complex, but there really isn't a standard explanation for all of it to give us some competition. So the challenge is simply to see if the present model can identify mechanisms that would produce the broad range of observations, without violating any fundamental principles of physics.
 
The first fact is that the total solar power output varies approximately 0.1%, on an 11.2 year cycle.1 The true significance of those numbers is easy to miss in the solar literature, but the reality is that it's a very slight difference, over a long period of time. Hence we shouldn't be looking for powerful mechanisms that throw the Sun into wild fluctuations. Rather, we should be curious about what keeps the power output so consistent. In that context, the study of the solar cycle is a search for near-perfect power regulator(s) whose nature(s) can be clarified by understanding the minimum and maximum output modes.
 
The most obvious aspect of the cycle is the number of sunspots. The Sunspots section explained these as electric currents similar to the current flowing through the granules, but with a greater current density, such that electrodynamic effects emerge, including self-stabilizing solenoidal magnetic fields. So why is there a cyclic increase in current density?
 
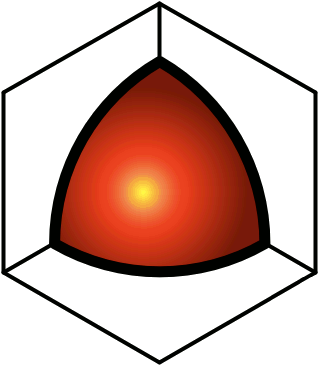
Figure 1. The boundaries between the equatorial band and polar caps in the convective zone.
First we should consider where sunspots occur. The convective zone has an equatorial band, spanning 30° N to 30° S, that rotates faster than the polar caps. Sunspots occur in the boundary between these masses. (See Figure 1.) As the sunspot maximum proceeds, the width of this band shrinks, eventually spanning only 5° N to 5° S, bringing the sunspots nearer the equator. So something about differential rotation is definitely conducive to sunspots, and the increased current density then produces 0.1% more power.
 
Some have suggested that boundary vortexes resulting from differential rotation encourage sunspots.2 But sunspots rotate extremely slowly, if at all, questioning the significance of vorticity. So we need to make a more detailed analysis, starting with what creates differential rotation in the first place.
 
The core and the radiative zone rotate as solid bodies. In the absence of convection (because of a lack of a heat source), all relative motion has ceased. But in the convective zone, relative motion does exist, and we wouldn't expect solid body rotation. Yet what happens doesn't match the initial expectations.
 
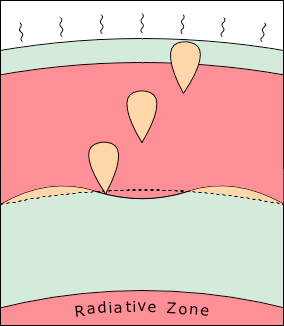
Given the conservation of angular momentum in an updraft, it should rotate slower than the plasma into which it rises, producing an apparent retrograde deflection. Figure 2 depicts an equatorial section looking down from the north pole, where the frame rotates counterclockwise with the Sun over a 3.62 day period. The s-wave at the bottom left generates a supergranule that should appear to move diagonally to the right as it rises. Similarly, downdrafts should rotate faster than the plasma into which they descend. So the upper convective zone should rotate slower than the solid body rate.
 
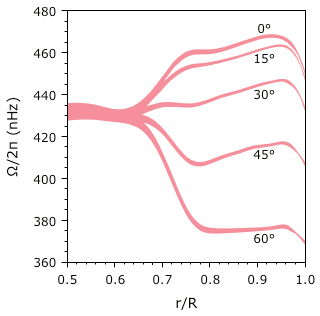
The deceleration of updrafts and the acceleration of downdrafts certainly happen in the topmost 25 Mm.3,4,5 (See Figure 3.) This suggests that there are robust convective currents in the topmost positive layer, driven by ohmic heating from the solar~heliospheric current.
 
Below 25 Mm, simple expectations are not met. In the lower latitudes, we actually see an acceleration, above the solid body rotation. And then in higher latitudes, where there is less angular momentum to conserve, there is an even more dramatic deceleration.
 
 
Figure 2. Apparent deflection due to conservation of angular momentum in an updraft.
Figure 3. Differential rotation per solar radius and latitude.
 
 
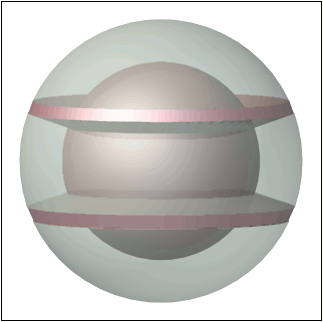
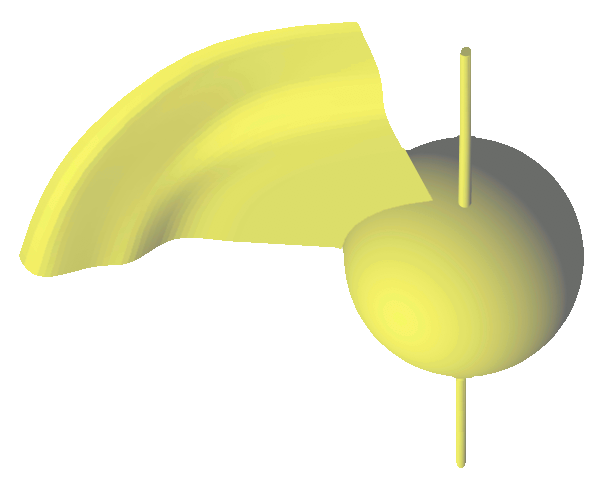
Figure 4 shows the data from Figure 3, in 3D. The sphere at the center denotes the core, about which we know little. The flat plane in the radiative zone reveals its solid body rotation. In the convective zone, equatorial plasma is accelerated, while polar plasma is decelerated.
 
 
Figure 4. Differential rotation for 0~75° latitude in one quadrant of the Sun.
 
 
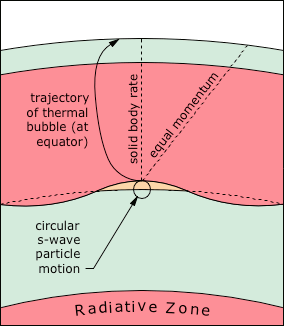
Figure 5. Acceleration of thermal bubble in direction of wave.
The acceleration in the lower latitudes can be attributed to the way supergranules are created by wave crests. (See Figure 5.) While there is no net flow in s-waves, there is a circular particle motion, and at the crest, the motion is in the direction of the wave. A thermal bubble generated by an s-wave inherits the momentum of the crest. Hence the equatorial waves create an equatorial acceleration. The equal-but-opposite deceleration in the higher latitudes is then easiest to explain as an eddy current flowing in the reverse direction.
 
As an aside, a bit of additional information can be gleaned from Figure 3, and integrated into the present model. Many researchers define the tachocline as being only .04 R thick, centered at roughly .7 R.6:3,7 This is because the "fusion furnace" model requires that the transition between heat radiation and convection be abrupt. Yet the only data that we have are helioseismic, and these show that the transition begins at the level at which the solid body rotation of the radiative zone ends (i.e., .66 R), and continues to the point of the stabilization of differential rotation (i.e., .76 R), amounting to a .1 R thickness. The standard model has no explanation for this, while the present model identifies a liquid helium & hydrogen layer (i.e., .7~.82 R), which is .12 R thick. The ionized liquid is frictionless, so the shear from differential rotation produces a laminar flow that transitions smoothly from the rotation of the radiative zone to that of the overlying convective zone.
 
So if s-waves at the liquid line are the prime mover behind the equatorial bands, why are these waves more pronounced at the equator? The Sun is a sphere, and all other factors being the same, it should be capable of sustaining s-waves equally in all directions.
 
But it's not that simple, because the Sun is rotating. This means that an s-wave crossing the poles encounters a reversal in the direction of the medium through which it travels. On its way toward the pole, conservation of momentum in the particle motions generates a Coriolis effect, with an apparent anterograde deflection, contrary to the actual motion of the medium. After crossing the pole and propagating back toward the equator, any loss of angular momentum results in a retrograde Coriolis effect. This twisting of the waves, which constantly sets them against the rotational "flow" of the medium, refracts the waves, and thereby dissipates their energy. Yet equatorial waves do not have this problem, and can continue in the same "direction" forever. So we can expect equatorial waves to be better organized, and more robust.
 
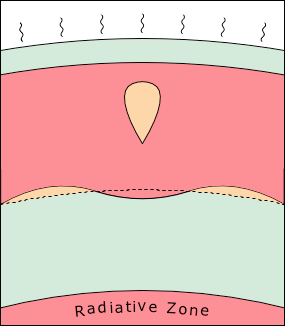
Figure 6. Thermal bubble pushes down the next trough.
One of the implications of this is that equatorial waves will fall into the nearest harmonic frequency, and this might be an important part of the solar power regulator. Here we should note that a wave cresting above the liquid line, and triggering an electrostatic discharge that generates an enormous amount of heat, is a wave that perpetuates itself, as the superheated plasma pushes down the next trough. Hence energy is added back to the mechanism that is releasing energy, establishing a positive feedback loop, which will increase the rate at which energy is released, until the next set of limits are hit. (See Figure 6.)
 
Those limits are a function of resonance. Larger waves travel at faster speeds, meaning longer wavelengths. Yet the spherical geometry of the Sun guarantees that only harmonic frequencies will resonate. Hence a positive feedback loop that increases the wavelengths will push the waves outside of the resonance frequency, and destructive interference will attenuate the wave heights. A positive feedback loop with a negative boundary condition produces energy at a regular rate, while competition between these opposing forces might also produce regular oscillations. Thus the peak mode starts with a wide equatorial band, where the positive feedback loop has accentuated the wave heights, but destructive interference attenuates them, first at higher latitudes, where the circumference is shorter, and then at progressively lower altitudes, causing the equatorial band to shrink. As such, the s-waves do, indeed, appear to be self-regulating. As noted previously, the energy conversions at the liquid line include electrostatic discharges as well as nuclear fusion in the discharge channels, both of which produce heat that is conducted and convected to the surface. Together these energy sources are responsible 1/2 of the total solar power.
 
The other 1/2 comes from ohmic heating in the topmost positive double-layer. Is that regulated too?
 
There the prime mover is CMEs. When these occur, positive ions are ejected, leaving the Sun with a net negative charge, and instantiating an electric field between the negative Sun and the positive heliosphere. The electric current responding to that field then causes the ohmic heating. So the question is, "Are CMEs regulated, and if so, how?"
 
One possible regulator was introduced in the Sunspots section (though that aspect of it was not mentioned). At the top of a sunspot, the solar~heliospheric current passes through the granular layer, which is cooler. Electron uptake in the cooler plasma increases the electrical resistance, reducing the electron drift velocity. The result is that the magnetic field lines close locally. This increases the density of the closing lines.
 
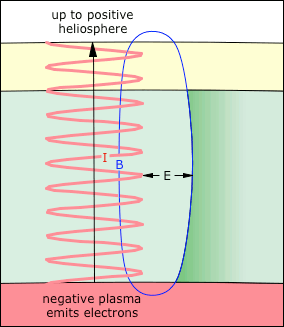
Figure 7. The magnetic field (B) of the sunspot maintains a charge separation, by braking the flow of +ions toward the negative charge inside the sunspot.
The CMEs section described how this local solenoidal field insulates opposite charges from each other (by introducing a Lorentz force perpendicular to the E-field). This creates the potential for a sub-surface flare and the subsequent CME. (See Figure 7.) The CME expels positive ions, creating the solar~heliospheric E-field that causes ohmic heating.
 
The net effect is that a cool granular layer sets up the conditions for the CMEs that drive the ohmic heating. The thicker the granular layer, the greater the chance of a CME that will thin it back out again. Thus the thickness of the granular layer is regulated, and therefore, the ohmic heating due to its thickness is regulated.
 
Now we just have to figure out why sunspots occur at the edges of the equatorial band.
 
The Sunspots section showed that the solenoidal magnetic fields have to be coming from a rotating current, and that this is expected when electric and magnetic fields line up. So one of the prerequisites for sunspots is that the lines of force from the Sun's overall magnetic field be normal to the surface, to get them parallel to the lines of the solar~heliospheric electric field. Once organized into a Birkeland current, the electrons can stream straight out into space. Where the overall lines of force are not normal to the surface, electrons don't have an open conduit to the heliosphere. At the equator, where the overall lines of force are parallel to the surface, the Lorentz force deflects the current toward the poles. So the magnetic and electric forces are in opposition, and the current is discouraged. (The same thing happens here on Earth. Charged particles from the solar wind are deflected by the Earth's magnetic field, and enter the atmosphere at the poles, causing the aurora. A similar current exiting the Earth would similarly be deflected.) From this we can infer that there is something about differential rotation that sets up magnetic lines of force normal to the surface at the boundary.
 
The Sun's magnetic fields are complex, and dynamic. As the Sun rotates, the charged layers generate magnetic fields. The fields from alternating layers cancel each other out, leaving the Sun with a very weak overall field (i.e., ~1 Gauss). The polarity of this field is a function of torsional oscillation, wherein the charged layers speed up and slow down relative to each other from one cycle to the next, and the field from the faster layer dominates.8 Magnetic pressure between the alternating layers makes it a winner-take-all phenomenon, and the polarity stays the same through the entire 11.2 year cycle.
 
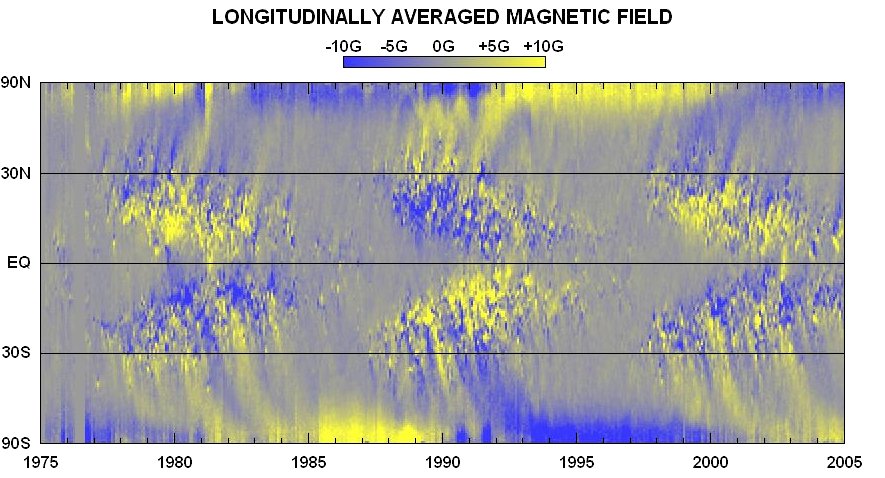
At a smaller scale, differential rotation in the upper convective zone results in the equatorial band generating a field with the same polarity as the overall field. But this more powerful field has shorter lines of force, some of them closing just across the equator, and the others diving back into the Sun in the 30~60° latitudes. This gets the lines from the polar field to close there, instead of going all of the way around to the other pole. (See Figure 8.)
 
 
Figure 8. In this "magnetic butterfly diagram," yellow regions are occupied by south-pointing magnetic fields; blue denotes north. At mid-latitudes the diagram is dominated by intense magnetic fields above sunspots. During the sunspot cycle, sunspots drift, on average, toward the equator — hence the butterfly wings. The uniform blue and yellow regions near the poles reveal the orientation of the Sun's underlying dipole magnetic field. Courtesy NASA. (See this also.)
 
 
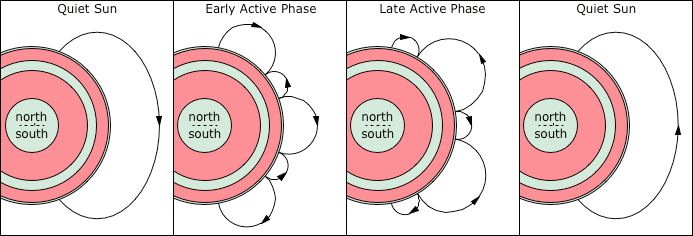
Figure 9 shows the fields in schematic form. Note that as the equatorial band shrinks, the mid-latitude fields come to dominate, eventually merging into an overall field that is opposite from the previous quiet phase.
 
 
Figure 9. Progression of magnetic fields through 11-year cycle.
 
 
During the quiet phase, there is a magnetic shield enveloping the majority of the Sun. And just like the Earth's magnetosphere discourages incoming currents (except at the poles), the quiet Sun's magnetosphere discourages the solar~heliospheric current. In this context, the fast solar wind emanating from the poles during the quiet phase makes sense. But even the polar currents are deflected somewhat, as all of the lines of force close within the Sun.
 
Now consider the effects of the more complex configuration during the active phase. The longer lines of force (not shown in Figure 9) don't have any obvious re-entry points, as there is no net overall field. Such lines can easily be converted into axial fields in Birkeland currents streaming out into space. So when we see sunspots forming where the magnetic lines of force are normal to the surface, and given that the prime mover is the solar~heliospheric current, and knowing that currents flow the best when the electric and magnetic fields are parallel, we can conclude that it is the magnetic fields of differential rotation that spawn sunspots.
 
To summarize, s-waves at the liquid line fall into harmonic frequencies around the equator. This produces waves of supergranules transporting heat to the surface. It also produces differential rotation, with an equatorial band rotating faster than the polar caps. At the edge of the equatorial band, the magnetic lines of force are normal to the surface, inviting the solar~heliospheric current to turn these into open lines out to the heliosphere. The increased charge density in the sunspots attracts positive ions, and short-circuit discharges cause CMEs that expel excess positive plasma into space. This regulates the resistance in the positive double-layer, and thereby the ohmic heating.


References

1. Willson, R. C.; Hudson, H. S. (1991): The Sun's luminosity over a complete solar cycle. Nature, 351 (6321): 42-44

2. Zhao, J.; Kosovichev, A. G. (2004): Torsional Oscillation, Meridional Flows, and Vorticity Inferred in the Upper Convection Zone of the Sun by Time-Distance Helioseismology. The Astrophysical Journal, 603: 776

3. Vorontsov, S. V. et al. (2002): Helioseismic Measurement of Solar Torsional Oscillations. Science, 296 (5565): 101-103

4. Korzennik, S.; Thompson, M. J.; Toomre, J. (1997): Internal rotation and dynamics of the Sun from GONG data. Proceedings of the 181<sup>st</sup> Symposium of the International Astronomical Union

5. Basu, S.; Antia, H. M. (2003): Changes in Solar Dynamics from 1995 to 2002. The Astrophysical Journal, 585: 553-565

6. Miesch, M. S. (2005): Large-Scale Dynamics of the Convection Zone and Tachocline. Living Reviews in Solar Physics

7. Charbonneau, P. et al. (1999): Helioseismic Constraints on the Structure of the Solar Tachocline. The Astrophysical Journal, 527: 445-460

8. Lanza, A. F. (2007): Angular momentum conservation and torsional oscillations in the Sun and solar-like stars. Astronomy & Astrophysics, 471 (3): 1011-1022


← PREV Powered by Quick Disclosure Lite
© 2010~2021 SCS-INC.US
NEXT →