© Charles Chandler"Seneca Guns" (also known as mistpouffers) are unexplained percussive sounds, similar to those of artillery fire. They are not indistinct rumblings, as if from distant thunder, but rather, they are very well-defined, meaning that the sources were nearby. Of the hundreds of reports of percussive sounds, about 2/3 can be dismissed as human-made, coming from supersonic aircraft, blasting associated with construction work, or something similar. The 1/3 that cannot be attributed to anything else are the curiosity.They occur in a wide range of conditions — at night and during the day, mostly in clear weather, without an accompanying flash indicative of lightning, typically near water but not always, and typically not at tectonic boundaries (ruling out seismic fault ruptures). The events do not even register on seismographs. This is odd because sonic booms from aircraft, and from thunder, can leave seismic traces. This can only mean that the entire countryside was not rattled by a large atmospheric shock front, where the cumulative effect was detectable inside the Earth. Rather, the sound had to come from a point source with much less energy, and where the energy dissipated by the inverse square law, producing no cumulative effect on the surrounding ground. Combined with the distinctness of the sounds, the sources had to be very near to the observers, since sounds lose their clarity with distance.This seems to rule out all known physical processes, meaning that the force responsible has yet to be discovered. So what is it?Recent studies of earthquakes have revealed electric currents, before, during, and after the quakes. We might think that shifting tectonic plates create static electricity, but the currents are detectable even before the plates shift. The only change is that the crust is getting deformed due to increasing tectonic pressure. So something about crustal deformation generates the electric currents.
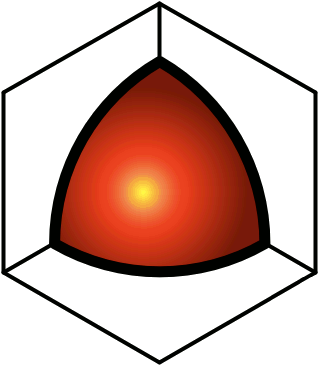
Figure 1. Charge Separation Under Pressure
At left is an abstract representation of a normal crystal lattice, using the familiar icon for an atom, and showing connections of electron shells. At right, extreme pressure has forced the expulsion of one of the electrons from the atom in the center. The expelled electron is to be found just outside, wherever there is room for it, while attracted to the positive ion by the electric force.
Electron Degeneracy Pressure
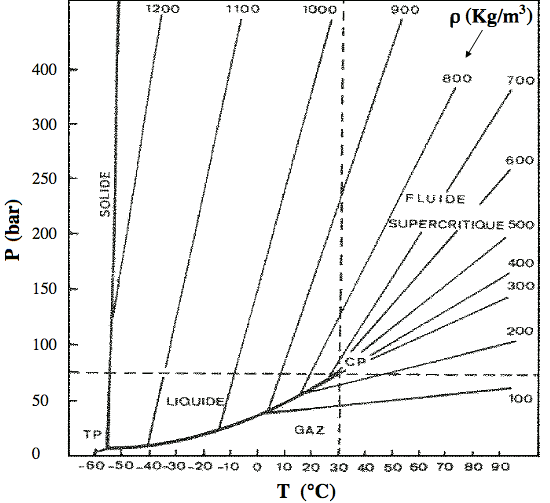
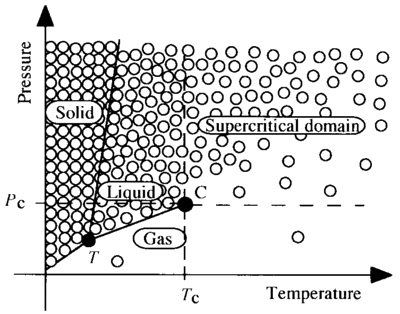
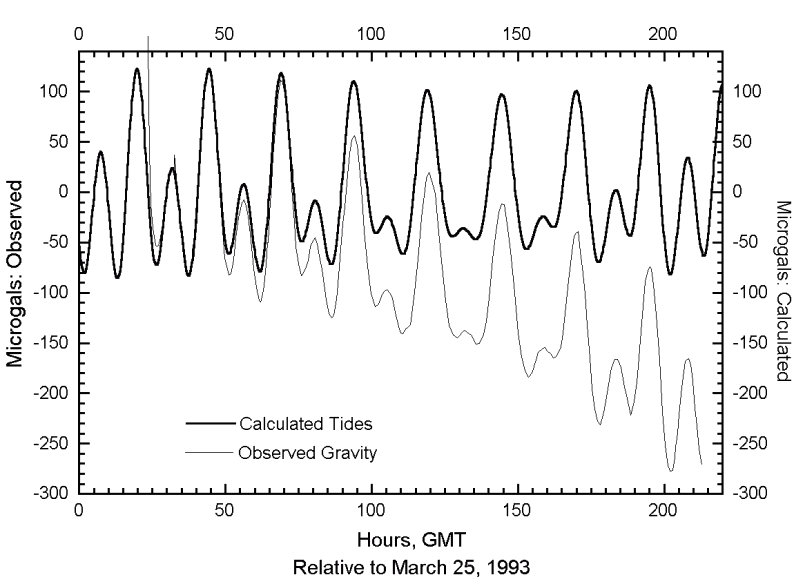
$$P=\frac{h^2}{20m_em_p^{5/3}}\left(\frac{3}{\pi}\right)^{2/3}\left(\frac{\rho}{\mu_e}\right)^{5/3}$$ where: P = pressure h = Planck's constant me = mp = ρ = density μe = electron/proton ratio Thus the Pauli Exclusion Principle holds even for supercritical fluids. Monoatomic matter above the critical point isn't constrained by covalent bonds. But when two atoms are forcibly pushed together, the first conflict will be between the outer electrons. If the pressure is greater than the ionization potential of the atoms, the conflict results in the expulsion of electrons, leaving a strong electrostatic repulsion between the positively charged atomic nuclei, and further compression has to fight the Coulomb force. This marks the transition from compressibility to elasticity, which is very different. The Quantum Mechanics term for this effect is electron degeneracy pressure (EDP), though the Pauli Exclusion Principle predated QM, and is not reliant on it.If the pressure is coming from gravitational loading, it increases with depth, meaning greater compression, and atoms packed closer together. At the threshold for EDP, electrons are expelled, and they have nowhere to go but up, where they will find room between atoms that aren't as tightly packed. Thus the expelled electrons are forced to a higher altitude, leaving positive ions below.The implication not typically considered is that a charge separation has occurred, creating current-free double-layers (CFDLs) — they are layers of opposite charges, with a powerful electric field between them, but there is no current responding to the field, because something prevents it. Usually a sustained charge separation requires an insulator, but in this case, EDP separates the charges and keeps them separate. And gravity is forcing the EDP. So as long as those forces are present, there will be a charge separation, and an electric field.As CFDLs, and all other factors being the same, there is plenty of potential, but no energy conversions. But if the pressure relaxes, EDP no longer forcibly ionizes the matter, and charges can recombine, driving an electric current. Similarly, if the pressure is restored, electrons are expelled from neutral matter, again driving a current. Thus the CFDLs are not entirely current-free if the pressure changes — there will be a current between the matter at the previous ionization boundary, to the location of the new boundary.The electric currents associated with earthquakes are then explained not as the consequence of plate movement, but rather, of changes in pressure at depth. The horizontal pressure that causes the crust to buckle relieves the vertical pressure under the buckle, thereby enabling electrons to flow downward to recombine with +ions. After the quake, the gravitational pressure is restored, forcing the re-expulsion of the electrons.Aside from tectonic forces, pressure inside the Earth can also be varied by tidal forces from the Moon and Sun. As a consequence, we can expect weak electric currents on a regular basis, leaving the surface more positively/negatively charged at high/low tides. Electric currents associated with tides are well-known, but they have always been attributed to static electricity generated by the moving water, and no study of telluric electric currents associated with inland tidal forces has been located thus far. But an indirect measure might have been found by a study of lightning in North Dakota, USA (which is definitely inland). In 10 years of data, the cloud-to-ground strike rate averaged 22% greater at high tide, which was statistically more significant than the other factors normally associated with lightning induction, such as topography, vegetation, and infrastructure.8 Since 85% of all CG strikes are from a negative charge in the cloud to a positive charge in the ground, this suggests that the ground had a stronger positive charge at high tide. And indeed, if the surface is elevated, the pressure underneath is relaxed, allowing charge recombination, and thus a downward flow of electrons, leaving the surface positively charged.Electric currents in the right conditions can graduate to plasma discharge channels (such as in lightning), which can definitely produce percussive sounds in the atmosphere. Hence it's possible that the "Seneca Guns" are caused by telluric currents that, in rare cases, get concentrated into discrete discharge channels, which are then overheated to the point of percussiveness. The regional preference of the booms might then have to do with the conductivity of the soil. For example, the huge sand deposits along the Carolina coast might provide the capacitance necessary for extreme potentials to develop before a discharge occurs. The soil at the southern ends of the Finger Lakes (especially Seneca and Cayuga, which are the largest, and where the booms are heard) is glacial till over 100 meters deep that is also poorly conductive. The significance of low-conductivity soils near large bodies of water might be that the capacitors have excellent discharge paths. No matter the net charge, a capacitor surrounded by other capacitors will hold onto its charge, but a capacitor near a conductor will discharge vigorously.To explore this, the first step was to see if there is a direct correlation between the booms and high/low tides. But instead of looking at tides as water levels, the forces responsible for the tides were used. The hypothesis is that crustal deformation is driving telluric currents, so the correlation point would be the times at which the crust is getting deformed by tidal forces. Water levels respond to these forces, but lag behind them due to the flow characteristics of the body of water in question. Also, the booms have occurred inland (e.g., Seneca NY, from which the booms get their name in the US), where water level tables are not available.Judson Ahern wrote a QBasic program that calculates the positions of the Moon and Sun at a given date/time, and then finds the tidal forces at a given latitude/longitude. Tom Van Baak did a C port that compiles into a command-line utility, which was more convenient for this project, in conjunction with a Pascal graphing routine by the present author. The accuracy of the code was verified by comparing its predictions to measurements from gravimeters.For the 54 reports that specify the times and locations of the booms, graphs of the tidal forces in the 24 hours spanning the events were generated. This revealed no preference for high or low tide, nor was there any pattern in whether the instantaneous tidal force was increasing or decreasing (i.e., 24 up and 30 down).But when the data were viewed at a coarser granularity, two patterns emerged. First, there was a considerable preference for winter months.
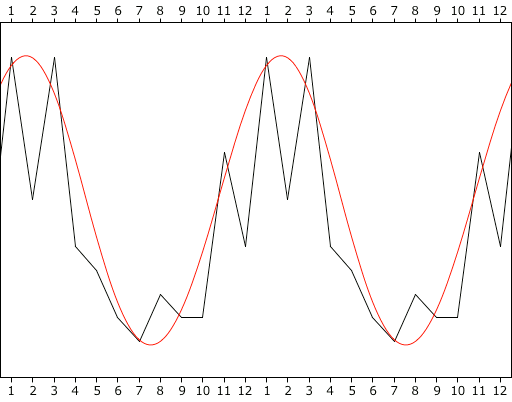
month 01 02 03 04 05 06 07 08 09 10 11 12 events 12 6 12 4 3 1 0 2 1 1 8 4 The pattern is easier to see in Figure 5, where the peak of the fit curve is at about Feb. 12, only 21 days past the winter solstice.There was also a preference for the new moon, and a stronger deference for the full moon.
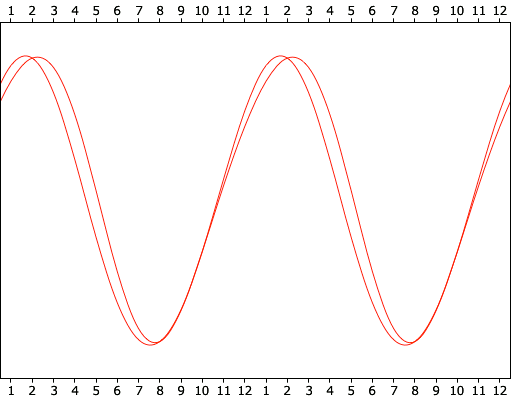
phase new first full third events 19 14 4 17 The combination of preferences for winter months and for the new moon is consistent with tidal forces as a key factor. That there was no direct correlation between high/low tides and the frequency of the events is consistent with the capacitor model, where it is not the tide-driven currents themselves that are causing the discharges. Rather, the tidal forces build up charges in the poorly conductive soils, which then discharge at random into nearby conductors.It's also interesting to note that the yearly cycle of the Seneca Guns is very similar to that for volcanoes, strongly suggesting that both have the same driving forces.Figure 6. Yearly cycles of Seneca Guns (peaking in early February) and the volcanoes (peaking in late February).Proof that the booms are caused by electrostatic discharges could be established with equipment capable of registering sounds as well as EMPs. If the present hypothesis is correct, the discharges produce EMPs similar to lightning. If multiple stations are set up, making it possible to triangulate the precise location of the events, it might be possible to find fulgurites left by the discharges (assuming that one of the footpoints was on land). Determining that the fulgurites were not left over from an earlier thunderstorm could only be done by immediately locating them, and finding that they are still anomalously hot.It might be possible to use iPhones as the instrumentation, since they have built-in magnetometers (used to improve GPS location). With an application that runs nonstop, and that records sound as well as magnetic field density, it might be possible to get the required data. This assumes that the magnetometer is sensitive enough. This could be determined by seeing if it can pick up the EMP from a lightning strike. If it can't do that, it definitely won't detect Seneca Guns. If it can, and the Guns are close enough, the EMP should register.
1. Saumon, D.; Chabrier, G. (1992): Fluid hydrogen at high density: Pressure ionization. Physical Review A, 46 (4): 2084-2100 ⇧
2. Dyson, F. J.; Lenard, A. (1967): Stability of Matter. I. Journal of Mathematical Physics, 8 (3): 423-434 ⇧
3. Lenard, A.; Dyson, F. J. (1968): Stability of Matter. II. Journal of Mathematical Physics, 9 (5): 698-711 ⇧
4. Dyson, F. J. (1967): Ground‐State Energy of a Finite System of Charged Particles. Journal of Mathematical Physics, 8 (8): 1538-1545 ⇧
5. Otles, S. (2016): Supercritical Fluids — Density Considerations. ⇧
6. Tosatti, E. et al. (2009): High-pressure polymeric phases of carbon dioxide. Proceedings of the National Academy of Sciences, 106 (15): 6077-6081 ⇧
7. Weill, F. et al. (1999): Supercritical fluid processing: a new route for materials synthesis. Journal of Materials Chemistry, 9 (1): 67-75 ⇧
8. Denham, L. et al. (2013): Dynamic Measurement Case Histories. Dynamic Measurement LLC ⇧
