© brantTo properly answer that question requires looking into the instrument that makes the measurement reponsible for the data used to determine the suns motion.
TIME-DISTANCE MEASUREMENTS OF LARGE-SCALE FLOWS IN THE SOLAR CONVECTION ZONE
http://soi.stanford.edu/papers/dissertations/giles/thesis/PDF/
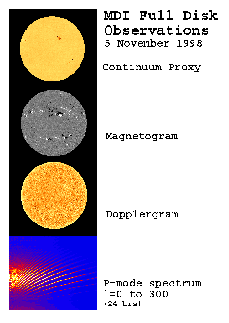
The Michealson Doppler Interferometer or MDI.
"The fixed filters have bandpass centered on the Nickel absorption line at 6768 Angstroms, which is formed near the middle of the photosphere."http://soi.stanford.edu/papers/dissertations/giles/thesis/PDF/PMG_Dissertation.pdf
Then on to the HMI on the SDO instrument...
Spectral Line Selection for HMI: A comparison of Fe I 6173 A and Ni I6768 A.
ABSTRACT We present a study of two spectral lines, Fe I 6173 Å and Ni I 6768 Å, that were candidates to be used in the Helioseismic and Magnetic Imager (HMI) for observing Doppler velocity and the vector magnetic field. The line profiles were studied using the Mt. Wilson Observatory, the Advanced Stokes Polarimeter and the Kitt Peak-McMath Pierce telescope and one-meter Fourier transform spectrometer atlas.
Both Fe I and Ni I profiles have clean continua and no blends that threaten instrument performance. The Fe I line is 2% deeper, 15% narrower, and has a 6% smaller equivalent width than the Ni I line.The potential of each spectral line to recover pre-assigned solar conditions is tested using a least-squares minimization technique to fit Milne-Eddington models to tens of thousands of line profiles that have been sampled at five spectral positions across the line. Overall, the Fe I line has a better performance than the Ni I line for vector-magnetic-field retrieval.
Specifically, the Fe I line is able to determine field strength, longitudinal and transverse flux four times more accurately than the Ni I line in active regions. Inclination and azimuthal angles can be recovered to ≈2° above 600 Mx cm−2 for Fe I and above 1000 Mx cm−2 for Ni I. Therefore, the Fe I line better determines the magnetic-field orientation in plage, whereas both lines provide good orientation determination in penumbrae and umbrae.
We selected the Fe I spectral line for use in HMI due to its better performance for magnetic diagnostics while not sacrificing velocity information.
The one exception to the better performance of the Fe I line arises when high field strengths combine with high velocities to move the spectral line beyond the effective sampling range. The higher g eff of Fe I means that its useful range of velocity values in regions of strong magnetic field is smaller than Ni I.
http://arxiv.org/pdf/astro-ph/0608124.pdf
The HMI instrument.
http://hmi.stanford.edu/proposal_April_2002/C.2_body.pdf
These instruments use un-ionized Nickel and Iron to make their doppler measurements. And they do it at very narrow filter widths MDI@94 mA(Milli Angstroms) and HMI @76mA meaning they are looking for very small shifts in wavelength.
Figure 2 suggests that on average the cores of
Fe 6173 and Ni 6768 are formed around 250km and 300 km, respectively, in
agreement with Bruls et al. (1990) and Norton et al. (2006). However, as can
be seen in Figure 3, there are large spatio-temporal variations of more than
150km (i.e. several pressure scale heights). The formation height of the core
of Fe 6173 varies between approximately 100 and 400 km, and that of Ni 6717
between approximately 150 and 450 km. It is important to keep this in mind
when talking about a \formation height".NLTE line formation of Fe for late-type stars. I. Standard stars with 1D and ( 3D) model atmospheresOne of the most commonly used methods to determine effective temperature Teff, surface gravity - log g and metallicity [Fe/H], is to exploit excitation-ionization equilibria of various chemical elements in stellar atmospheres. Iron, with its partly filled 3d subshell, has, by far, the largest number of lines all over the spectrum of a typical late-type star. This atomic property coupled to a relatively large abundance makes it a reference element for spectroscopic estimates of stellar parameters.
http://arxiv.org/pdf/1207.2455v1.pdf
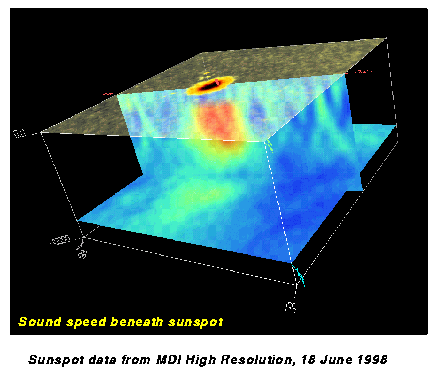
Here is a measurement of the velocity under the sunspot...
Developing Spot RegionTime-Distance methods provide a method to infer sound-speed variations and flows in the interior. This view shows sound speed variations beneath a sunspot. The spot was observed in June 1998 just prior to the SOHO 4-month interruption. This image was used on the group Christmas card with the following text:
"An image of the sound speed below a sunspot derived from dopplergrams observed with the Michelson Doppler Imager onboard the Solar and Heliospheric Observatory spacecraft using the technique of time-distance helioseismology. Three planes are shown, on top the intensity at the surface which shows the sunspot with the dark central umbra surrounded by the somewhat brighter, filamentary penumbra. The second plane is a vertical cut from the surface to a depth of 24000 km showing areas of faster sound speed as reddish colors and slower sound speed as bluish colors. The sound speed is affected both by the temperature of the gas and the magnetic field, which we know to be strong in the sunspot at the surface. The normal increase of sound speed with depth in the sun has been subtracted so that we are only looking at deviations from the average. The third plane (bottom) is a horizontal cut at a depth of 22000 km showing the horizontal variation of sound speed over a region of 150000x150000 km."
I contend the the blue space underneath the sunspot is the photosphere and that the red area under the sun spot is actually inside the iron surface...
They are measuring the velocity of the current flow up to the sun spot...
The MDI and HMI are measuring Doppler at a surface...
On the Formation Height of the SDO/HMI Fe 6173 Doppler Signal
http://arxiv.org/abs/1104.5166
Instrument Response function for filtergraph instruments
http://books.google.com/books?id=0KYsn7DVG34C&pg=PA490&lpg=PA490&dq=doppler+formation+height&source=bl&ots=3msQUC9xwW&sig=SxsJi-LcC-zvGUE63KRV7uA_nf0&hl=en&sa=X&ei=98qhUYfVMsvoiwKw9IHAAQ&ved=0CFUQ6AEwBw#v=onepage&q=doppler%20formation%20height&f=falseTo be continued...........
Here is the movie of a Tsunami on the sun..... The sign of the wavefront seems to determine the visibility to the features below. When the wave has a positive sign the wave top has a higher opacity. When the sign is negative, opacity to the features below is at a minimum.
http://soi.stanford.edu/press/agu05-98/flare.mpg
An amazing Coronal Rain video
https://www.youtube.com/watch?v=VvlyE4AQIFY
https://www.youtube.com/watch?v=nlWmwWy0yZ0
Image showing more of a 3d look at a sunspot....


